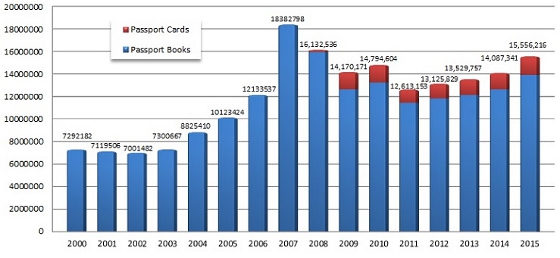
The number of Americans who obtained passports increased more than 300%
between 1974 and 2004. Although 9/11 had an impact on the number of
passport applications processed in 2002, the effect did not last long.
The number of passports issued continued to increase until 2007. That year witnessed the issuance of the greatest number of passport due to the introduction of the Western Hempisphere Travel Initiative.
There
was a decrease in the number of passports issued in 2008 and again in
2009. The last four years have witnessed a gradual increase in the number of passport issued. Passport Services expects a significant increase this year and next since passports issued in 2007 are coming up for renewal.

Expedite Your Passport Now!
U.S. Passports Issued per Fiscal Year (2000 - 2015):
|
|
Passport Cards Issued
Passport cards were first issued on July 14,2008.
|
|
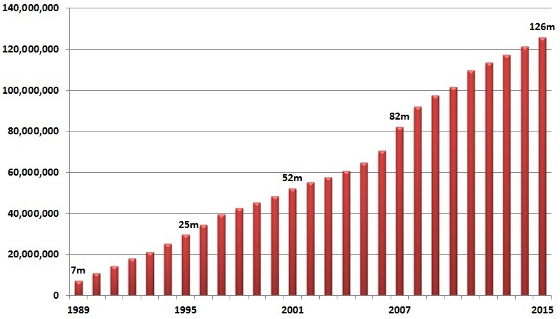
Number of American Passports in Circulation
|
|
More Passport Statistics
Number of U.S. Passports Issued by State
Number of Passport Application Acceptance Facilities by State
Top 5 Questions About Expedited Passport Couriers
1. How can you get a passport when you're in a hurry?
2. What exactly does a passport expediter do?
3. Are passport expediting services legitimate?
4. How can I identify a reliable passport expeditor?
5. Is expedited passport service worth it? Get answers to these questions and more in our Ultimate U.S. Traveler's Guide to Passport Expediters.
2. What exactly does a passport expediter do?
3. Are passport expediting services legitimate?
4. How can I identify a reliable passport expeditor?
5. Is expedited passport service worth it? Get answers to these questions and more in our Ultimate U.S. Traveler's Guide to Passport Expediters.
You can also visit our library of articles about passport expediting.
In a Hurry? Get Reliable Expedited Passport Courier Service:Expedite My U.S.Passport Now!